

On-chain metrics are essential for understanding blockchain networks. They reveal user activity, transaction patterns, and economic health, helping Web3 projects grow and maintain balanced token economies.
Key insights:
Active Addresses: Track unique wallets to measure engagement and retention.
Transaction Volume: Analyze transaction counts, values, and types to gauge activity.
Smart Contract Usage: Monitor interactions to assess dApp utility.
DeFi TVL: Reflects trust and adoption in decentralized finance.
NVT Ratio: Compares market cap to transaction volume for valuation insights.
What Are On-Chain Metrics?
Key On-Chain Growth Metrics
When it comes to understanding blockchain performance, specific metrics provide direct insights into network activity and user engagement.
Active Address Analysis
Active addresses measure how many unique wallet addresses interact with a blockchain, whether through transactions or smart contract calls. This metric is a key indicator of user engagement. By looking at daily and monthly active addresses, you can gauge user retention and see how diverse the network’s activity is. For instance, a steady increase in active addresses suggests a growing and possibly more diverse user base, while stagnation or concentration among a few addresses may point to limited adoption.
Transaction Volume Metrics
Transaction volume highlights how much the network is being used and the level of economic activity happening on it. To get a clearer picture, it’s important to filter out automated or spam transactions. This metric includes factors like the total number of transactions, their values, gas fees, and the types of transactions (e.g., transfers, swaps). Together, these details show how active and economically viable the blockchain is.
Smart Contract Usage Data
Tracking smart contract interactions helps measure the utility of decentralized applications (dApps) on the network. Key data points include how often contracts are deployed, which functions are being called most frequently, and the gas consumed by these interactions. This information is invaluable for developers, as it identifies which features users find most useful and where additional improvements might be needed.
DeFi Total Value Locked (TVL)
Total Value Locked, or TVL, reflects the level of trust and adoption for decentralized finance (DeFi) platforms. Important components of TVL include:
Asset Distribution: The percentage of TVL allocated across different tokens.
Lock Duration: The average time assets remain locked in the platform.
User Concentration: How TVL is spread across different users or addresses.
Growth Rate: Month-to-month changes in TVL that show adoption trends.
NVT Ratio Analysis
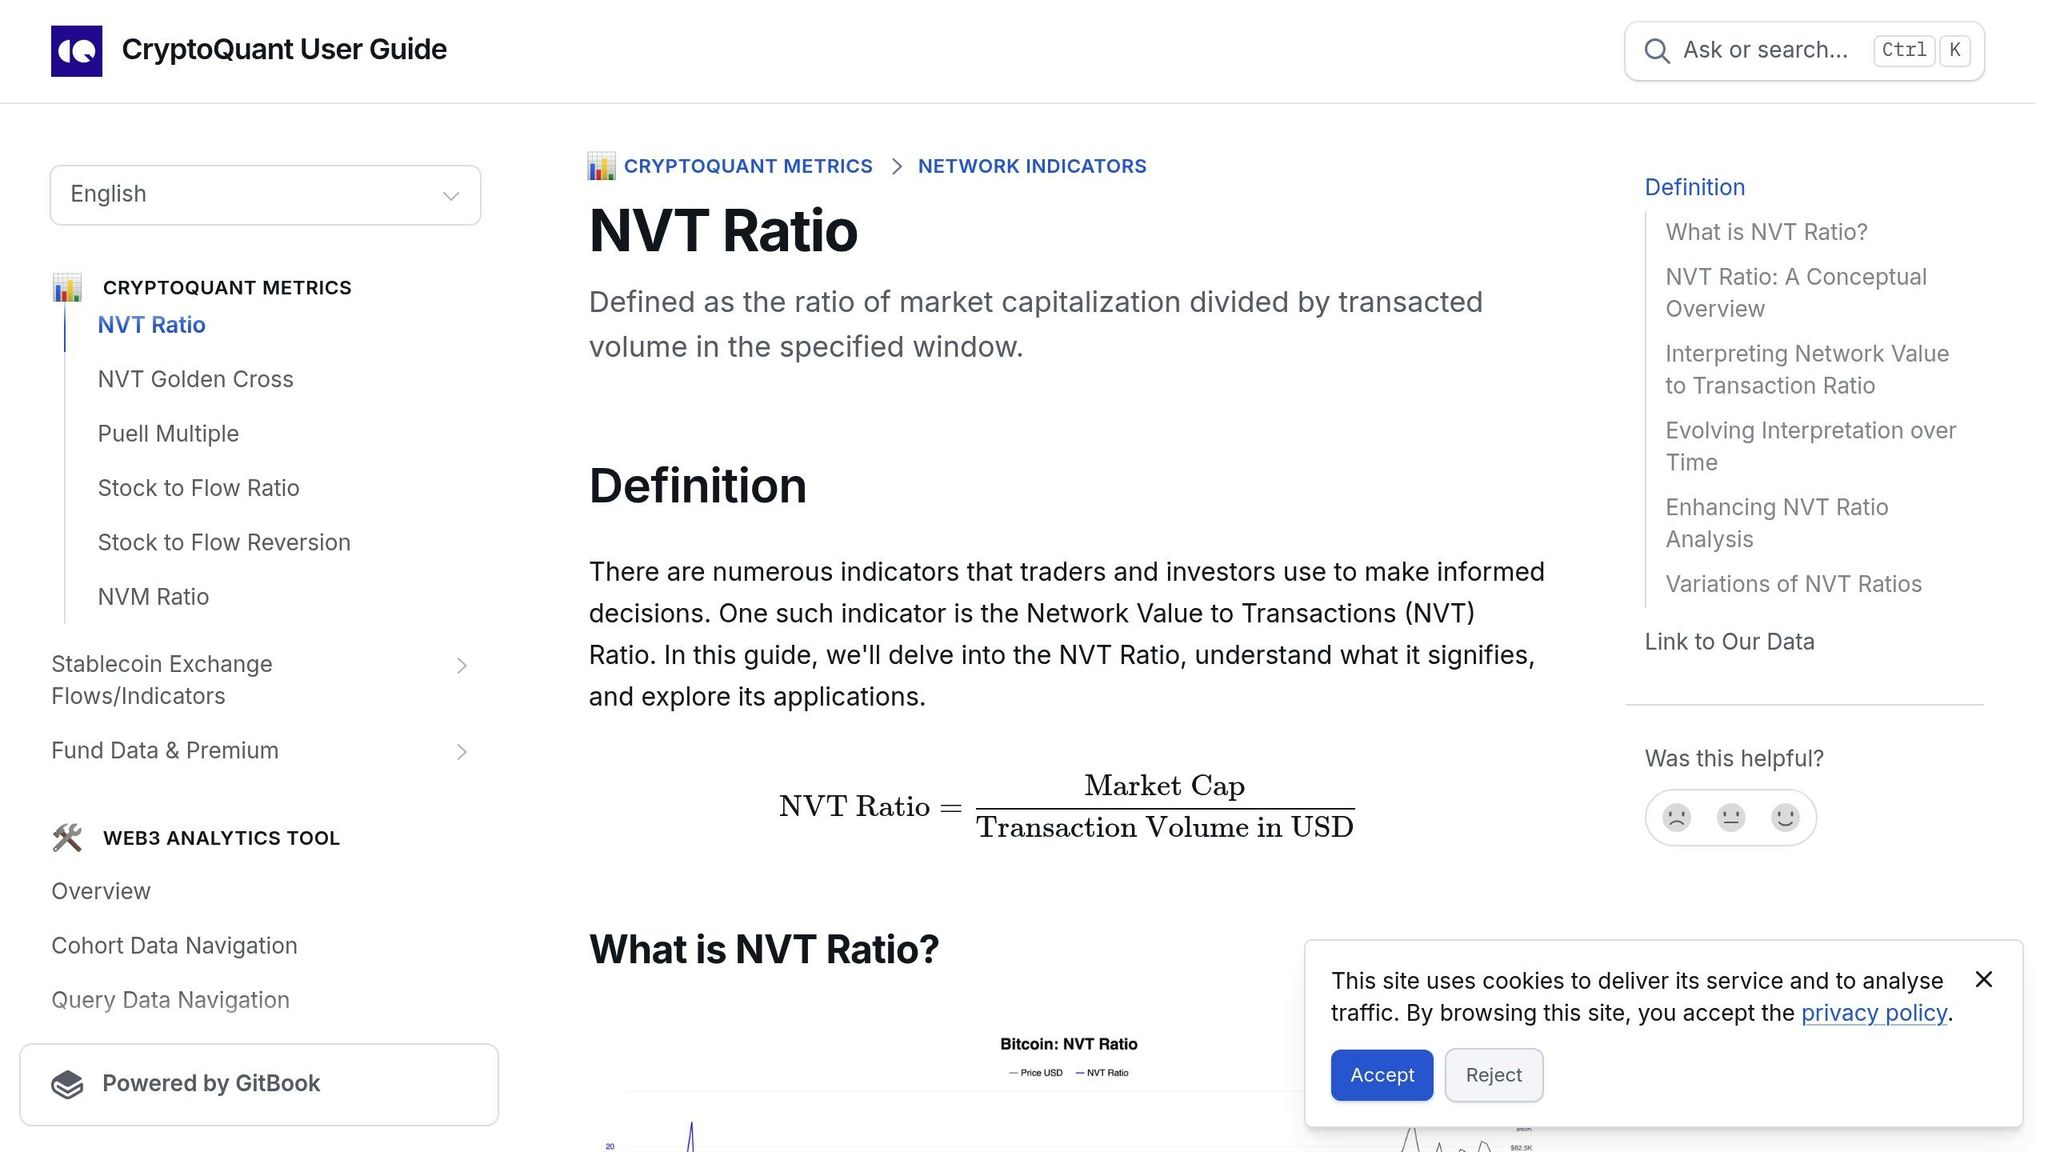
The Network Value to Transactions (NVT) ratio compares a blockchain’s market cap to its transaction volume. It’s a way to assess whether the network’s valuation aligns with its actual usage. A stable or declining NVT ratio often signals a healthy network, while a sharp increase could indicate overvaluation or speculative behavior.
Metric Impact Factors
Understanding the factors that influence on-chain metrics can help reveal genuine network growth and activity.
Network Speed and Costs
Transaction speed and fees play a big role in user engagement. High fees or slow transaction times can frustrate users, leading to reduced activity. Keeping an eye on these elements is key to understanding changes in on-chain metrics and evaluating the network's overall health.
User Types and Market Effects
Different user groups and market sentiment directly impact transaction volumes and active address counts. Identifying these patterns helps ensure on-chain data is interpreted correctly. Shifts driven by the market also provide context for understanding how platform changes affect metrics.
Platform Updates and Growth
Technical updates and protocol changes often alter network behavior. New features or processing adjustments can lead to noticeable shifts in user activity. Monitoring these developments can offer insights into potential future trends in network performance.
Metrics in Token Design
Combined Metric Analysis
Effective token design relies on analyzing on-chain metrics to understand both network growth and user behavior. By looking at transaction volumes, active addresses, and smart contract usage together, projects can uncover patterns that show real adoption.
Here are some key indicators to track:
Metric Category | Key Indicators | Growth Signals |
|---|---|---|
User Activity | Daily/Monthly Active Addresses, Retention Rate | Consistent rise in returning users |
Transaction Data | Volume, Frequency, Average Size | More transactions with stable averages |
Smart Contracts | Interaction Rate, Unique Users | Increase in distinct contract users |
Value Metrics | Total Value Locked, Token Velocity | Higher TVL with balanced circulation |
"We'll build a dynamic simulation so you can see how growth, user behavior, and market fluctuations affect your ecosystem." - Tokenomics.net
This comprehensive approach to metrics helps shape smarter token models by providing a clear picture of how the network operates and evolves.
Metric-Based Token Models
Using combined metric analysis, token incentives can be tied directly to on-chain data. This means rewarding participation, aligning token distribution with growth, and making adjustments based on usage trends.
Token models should include:
Activity-Based Incentives: Reward users for meaningful participation, like frequent transactions or engagement with smart contracts.
Growth-Driven Distribution: Allocate tokens in a way that reflects measurable growth in the network.
Dynamic Adjustments: Build in mechanisms to adapt as user behavior and network activity change.
Simulations from Tokenomics.net demonstrate how combining different metrics can shape token utility, helping teams spot potential issues before launch. To succeed, token models need clearly defined benchmarks tied to these metrics. This alignment ensures stakeholders benefit from network growth while maintaining a balanced and scalable token economy.
Conclusion
Using on-chain metrics in token design is crucial for promoting network growth and maintaining economic stability.
Key Takeaways
On-chain metrics like active addresses, transaction volumes, smart contract usage, and value measures offer a detailed look at the progress of Web3 projects. These metrics help projects:
Understand growth by focusing on user retention
Measure adoption through transaction data
Analyze economic activity with Total Value Locked (TVL)
Evaluate network development using the NVT ratio
These indicators help predict growth, highlight potential challenges, and support the creation of sustainable token economies. Clear insights from these metrics are the foundation for designing effective token models and planning strategies.
Tokenomics.net Services

To fully leverage on-chain metrics, advanced tools and expert advice are key. Founder Tony Drummond's experience - raising over $50 million across 40+ projects - proves the effectiveness of this approach.
Tokenomics.net offers services to turn these insights into actionable outcomes for projects:
Service Component | Key Deliverables |
|---|---|
Dynamic Simulations | Testing growth scenarios, analyzing token utility |
Metric Analysis | Identifying user behavior and network growth trends |
Token Model Design | Structuring incentives and distribution for growth |
Strategic Planning | Developing fundraising strategies and investor materials |